A posteriori analysis of the 16 November 2025 flood event on the Ardèche river, reported by the Service de Prévision des Crues du Grand Delta (SPC Grand Delta)
Flood forecasting systems don’t always behave the way we expect. Sometimes, the earliest forecast is the most accurate – and subsequent runs, theoretically more reliable because they’re closer to the event, progressively attenuate the signal. That’s exactly what happened on the Ardèche river in November 2025.
This blog article documents the a posteriori analysis carried out by BWI’s development team following a flood event on 16 November 2025, reported by SPC Grand Delta. The objective: determine whether the weakening signal in later model runs was caused by changes in meteorological inputs – or by something else in the modeling chain.
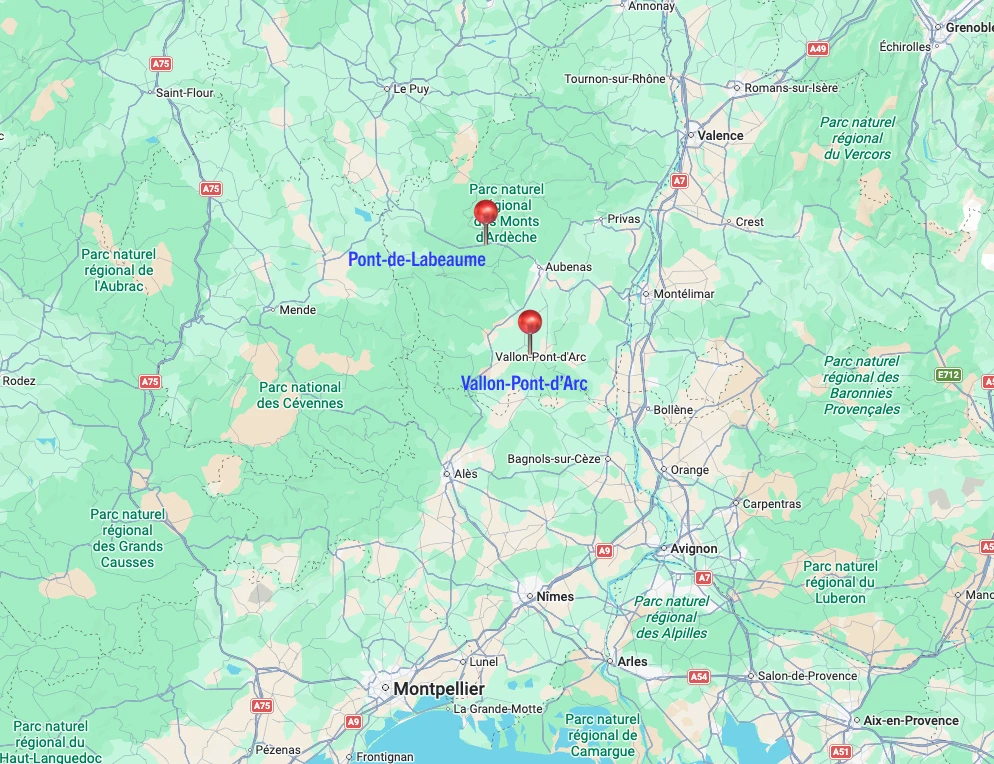
The two monitored stations are located in the Ardèche department, in southern France – a territory known for its intense flash flood episodes, particularly in autumn. The map below shows their positions on the river network.
The analysis points to a single root cause: the meteorological input changed between runs, not the hydrological model.
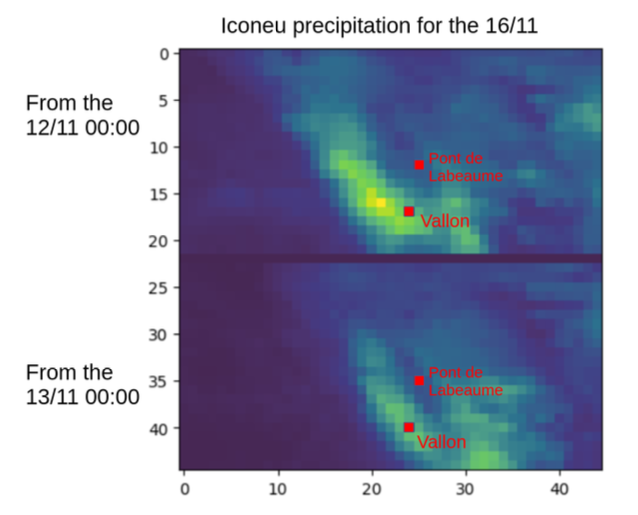
On 12 November, the ICON-EU forecast placed the heaviest precipitation directly over – and upstream of – both station catchments. By 13 November, two things happened simultaneously: the intensity of forecasted rainfall decreased, and its spatial footprint shifted slightly westward.
The Vallon catchment extends primarily to the north and east of the station. With the rainfall zone shifting westward, a significant portion of precipitation no longer fell within the effective drainage area – enough to drop the simulated discharge below the alert threshold.
For Pont-de-Labeaume, the precipitation pattern around the catchment changed very little between the two runs – which explains why the alert remained active for that station throughout.
More recent forecasts are not always more accurate. In this case, the earliest run captured the event with greater spatial precision than the runs that followed. This is a known characteristic of probabilistic meteorological forecasting – and it has direct implications for how alert systems should be interpreted by operators.
Small spatial shifts in precipitation – even a few tens of kilometers – can be the difference between a catchment receiving enough rainfall to trigger a flood and one that doesn’t. This sensitivity is particularly acute for smaller or asymmetrically shaped catchments like Vallon’s.
A posteriori analyses like this one are not post-mortems – they are part of how operational forecasting systems learn and improve transparency over time.