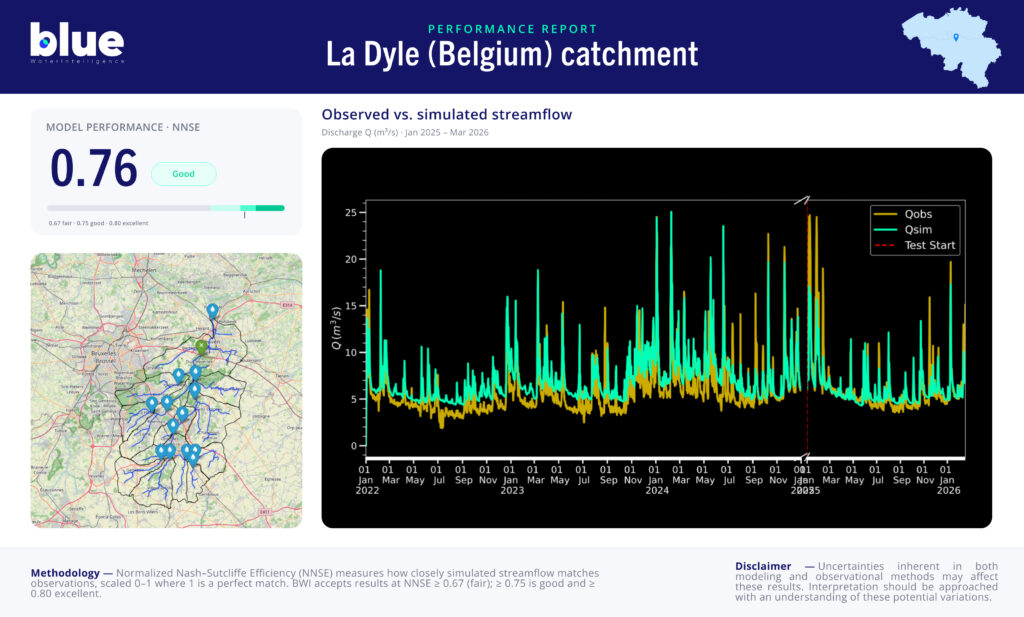
BWI’s hydrological model for the La Dyle catchment in central Belgium achieves a catchment-area-weighted mean NNSE of 0.76 on the testing dataset (January 2025 – March 2026), with 9 of 10 validated stations exceeding the deployment threshold of NNSE 0.65. The model demonstrates reliable performance across a mixed agricultural and urban catchment with no dam regulation, where seasonal variability and land-use influence on runoff are the primary hydrological challenges.
La Dyle is an 86-kilometre river in central Belgium, flowing through the provinces of Walloon Brabant, Flemish Brabant and Antwerp before joining the Rupel as a left tributary. Its source lies in Houtain-le-Val near Nivelles, and it passes through the cities of Ottignies, Wavre, Leuven and Mechelen. The model covers a drainage area of 910.985 km² comprising 140 reaches, with 12 hydrometry stations and no EU Hydro dams — a fully unregulated system where discharge variability is driven entirely by precipitation and land-surface processes.
The Dyle catchment landscape is characterised by hilly terrain with a clear river valley, a mix of forest and extensive arable land, and significant groundwater dependence — 80% of Belgium’s drinking water is extracted from aquifers. The climate is temperate oceanic, with moderate seasonal variability and a winter-dominant high-flow regime. Long-term land use change has shaped the catchment’s hydrological behaviour, with urban expansion and agricultural intensification influencing runoff dynamics over recent decades.
The primary water management challenges on La Dyle are flood anticipation in its urbanised reaches — particularly around Wavre and Leuven — and seasonal low-flow monitoring in support of water quality and ecological flow obligations under the EU Water Framework Directive.
The model was trained on data from January 2022 to January 2025, and evaluated on an independent test period from January 2025 to March 2026.
Performance is consistent across the validated station network, with a weighted mean NNSE of 0.76 — comfortably above the 0.67 threshold at which baseflow and flood event timing are reliably captured. One station reaches NNSE 0.81, demonstrating strong peak flow agreement at that location. One station falls below the 0.65 threshold (minimum 0.57), reflecting localised complexity — likely related to urban drainage dynamics or tributary confluence effects in that sub-catchment. The standard deviation of 0.07 is slightly higher than the Mayenne model (0.05), consistent with the greater heterogeneity of an unregulated catchment spanning both rural and urban land uses.
A weighted mean NNSE of 0.76 on an unregulated, mixed-use catchment like La Dyle is a strong result. It means the model reliably captures the seasonal rhythm of the river — winter high flows, summer low flows — as well as the timing of flood events driven by rainfall, which is the most operationally critical capability for basin managers and urban flood risk services in the Walloon and Flemish Brabant regions.
For flood early warning, the model provides sufficient lead time and discharge accuracy to support alert thresholds at the main monitored points along the Dyle — including the urbanised stretches around Wavre and Leuven where flood exposure is highest. For water resource planning, the seasonal flow simulation supports ecological flow monitoring and water quality management obligations under the EU Water Framework Directive.
The one underperforming station is a known limitation and is flagged for investigation in the next retraining cycle. As additional observational years are incorporated, performance at that location is expected to converge with the rest of the network.
Overall, this model is well-suited for operational deployment across the La Dyle catchment and represents a strong baseline for 10-day discharge forecasting in the Belgium context.
Interested in forecasting performance for your catchment? → Request a demo
For an explanation of the performance metrics used in this report — NNSE, NSE and their respective thresholds — see our model performance methodology page.