BWI release v2.17 brings a new Data Origins Viewer to the portal, an important API update, and a series of improvements to clarity, navigation, and usability. Here’s everything that’s new.
Release v2.17 brings a new way to inspect the data behind your forecasts, an important API update, and a series of improvements to clarity and usability across the portal.
A forecast is only as trustworthy as the data behind it. But where does that data actually come from? Data Origins answers exactly that.
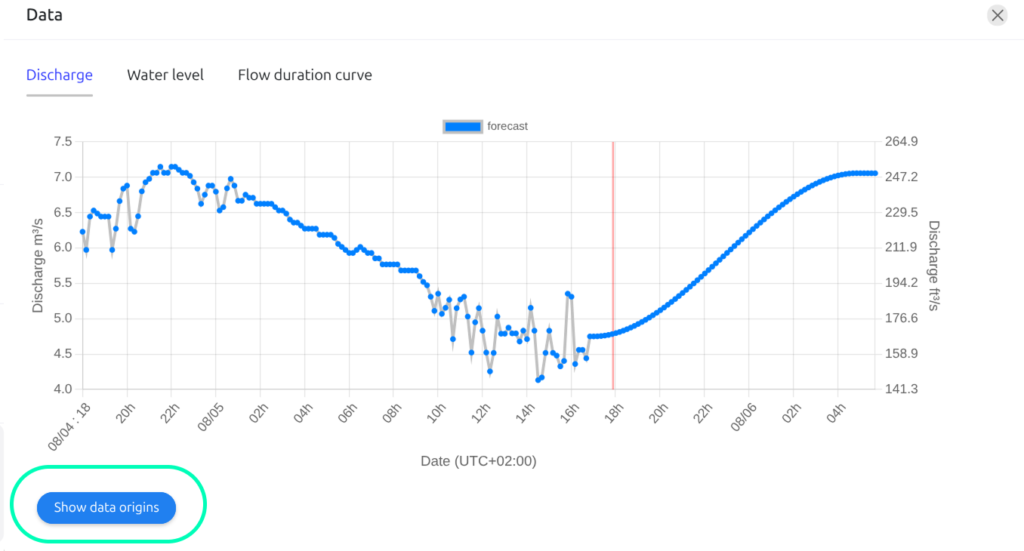
After introducing it via the API during our last release, we’ve now brought it into the portal through a dedicated viewer.
Using the new “Show Data Origins” button, you can now inspect the sources behind your forecasts directly in the interface, without leaving the portal. You can display up to five virtual stations at once, select the specific properties you want to inspect, deselect any stations you don’t need, and download your selection in JSON.
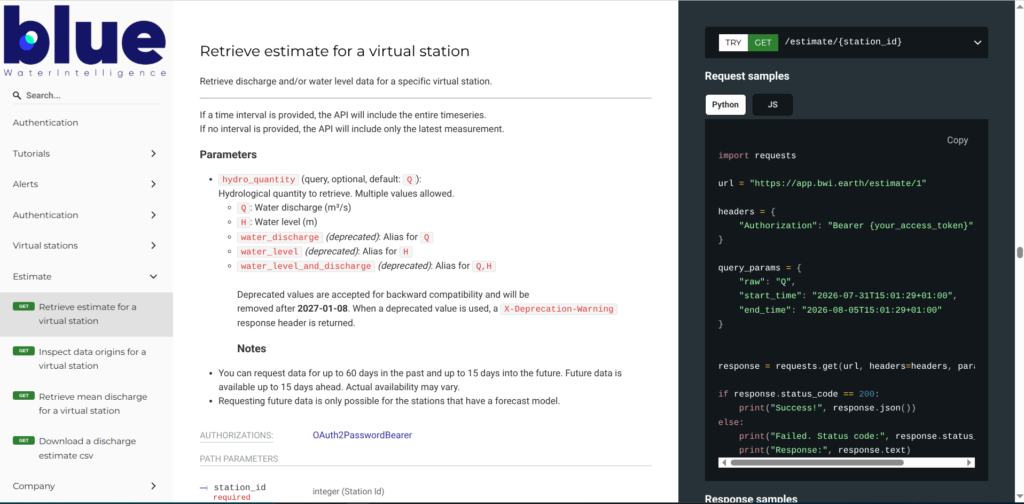
We’ve updated one of the API’s most-used endpoints, Retrieve estimate for a virtual station, to make requesting data simpler and more concise.
Previously, retrieving a hydrological quantity meant using verbose values such as water_discharge, water_level, or water_level_and_discharge. These have now been replaced by short, standard codes:
Q — water discharge (m³/s)H — water level (m)Multiple values are now allowed in a single request. The previous values are still accepted for backward compatibility, but are now deprecated and will be removed after 8 January 2027. We recommend migrating existing integrations to Q and H before then. Full details are in the updated API documentation.
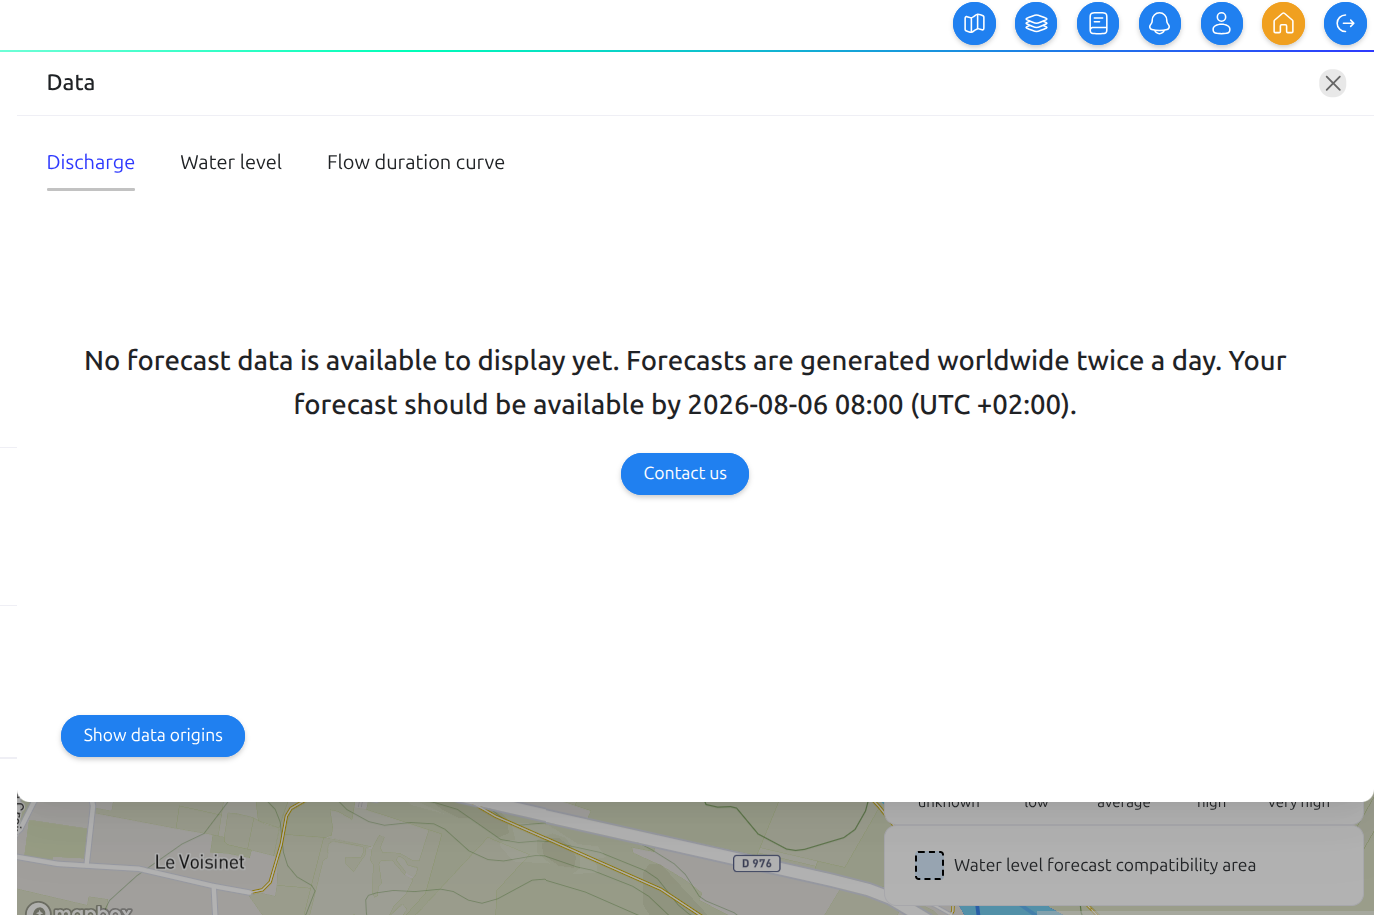
Sometimes a virtual station is deployed but its forecast doesn’t appear straight away. In most cases, this isn’t an issue – it’s by design.
BWI generates forecasts on a fixed cycle, twice a day. If a station is deployed (and its forecast requested) while that generation cycle is already running, the new forecast simply won’t appear until the next cycle completes. Everything is working as intended: the forecast will be available at the next scheduled generation. v2.17 makes this clearer to users, so a normal wait is no longer mistaken for a problem.
We’ve refined several elements of the portal interface to make it easier to know where you are and what each control does:
Downloaded data previously carried a long string of decimal places – far more precision than anyone works with in practice. Downloads now round to a maximum of three decimal places, for cleaner, more usable files.
These improvements are the result of the hard work of our development team and the valuable feedback of our clients. Together, they make each release sharper than the last. We’ll keep building and improving, so that BWI can continue to give water managers the clarity and confidence they need to protect and anticipate the resource that matters most.